Category Archives: Income
A Guide to Statistics on Historical Trends in Income Inequality
The Center for Budget and Policy Priorities released a new report of income inequality in the U.S. Click Here.
The report provides detail about the data used to analyze income and wealth inequality and a serious analysis. Excellent for use in a research methods class.
The summarized the basic facts of income inequality over the past six decades :
- “The years from the end of World War II into the 1970s were ones of substantial economic growth and broadly shared prosperity.
- Incomes grew rapidly and at roughly the same rate up and down the income ladder, roughly doubling in inflation-adjusted terms between the late 1940s and early 1970s.
- The income gap between those high up the income ladder and those on the middle and lower rungs — while substantial — did not change much during this period.
- Beginning in the 1970s, economic growth slowed and the income gap widened.
- Income growth for households in the middle and lower parts of the distribution slowed sharply, while incomes at the top continued to grow strongly.
- The concentration of income at the very top of the distribution rose to levels last seen more than 80 years ago (during the “Roaring Twenties”).
- Wealth — the value of a household’s property and financial assets, minus the value of its debts — is much more highly concentrated than income. The best survey data show that the top 3 percent of the distribution hold over half of all wealth. Other research suggests that most of that is held by an even smaller percentage at the very top, whose share has been rising over the last three decades.”
The Shrinking Middle Class
PEW posted a report on the shrinking middle-class. See link: PEW Report. The bottom line is: “The national trend is clear—the middle class is losing ground as a share of the population, and its share of aggregate U.S. household income is also declining.”
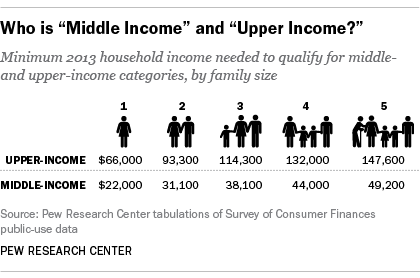
The first question: how do they define middle-class? It is complicated. They start by basing the calculations on household income and family size. They state: In this report, “middle-income” Americans are defined as adults whose annual household income is two-thirds to double the national median, after incomes have been adjusted for household size. In 2014, the national middle-income range was about $42,000 to $125,000 annually for a household of three. Lower-income households have incomes less than 67% of the median and upper-income households have incomes that are more than double the median.”
According to PEW, a family of 4 is middle-class if their income is between $48,083 and $144,250.

Income Gap Continues to Widen
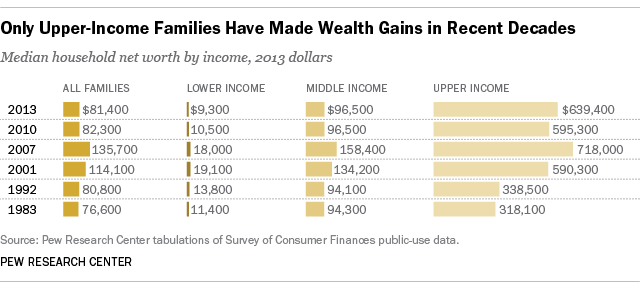
PEW released a new report showing that both the income and wealth gap continued to widen between the upper class and the middle and low classes.
Click Here for Report
Of course, it helps to know how they define middle class. I am not sure that a single person earning $22,000 would see that as a middle class wage. In many parts of the country, it would not even be a living wage.
They also look at wealth differences:
The Politics of Income Inequality: The story continues
article in NY Times: Click Here
Spinning Upward Mobility
Today (January 23, 2014), the New York Times had an article with the headline: “Upward Mobility Has Not Declined.” Reading just the headline, you might wonder what all the fuss is about. The lead paragraph states:
“The odds of moving up — or down — the income ladder in the United States have not changed appreciably in the last 20 years, according to a large new academic study that contradicts politicians in both parties who have claimed that income mobility is falling.”
But is the headline accurate? Not really. The author of the study, it appears, made the case that “Despite less discrimination of various kinds and a larger safety net than in previous decades, the odds of escaping the station of one’s birth are no higher today than they were decades ago.”
So, while mobility rates have not declined, they have not increased either. The more accurate summary would be that upward mobility has not changed in the past 2 decades. Continue reading
PEW Poll on Income Inequality
PEW released a report on its polling data about income inequality. To see their report: Click Here
They state:
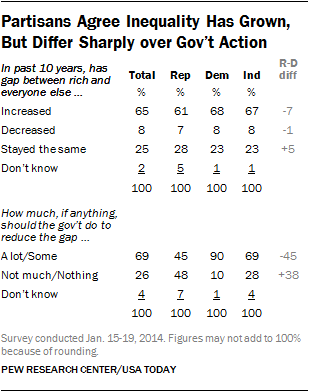 “There is broad public agreement that economic inequality has grown over the past decade. But as President Obama prepares for Tuesday’s State of the Union, where he is expected to unveil proposals for dealing with inequality and poverty, there are wide partisan differences over how much the government should – and can – do to address these issues.”
“Partisans Agree Inequality Has Grown, But Differ Sharply over Gov’t Action: The new national survey by the Pew Research Center and USA TODAY, conducted Jan. 15-19 among 1,504 adults, finds that 65% believe the gap between the rich and everyone else has increased in the last 10 years. This view is shared by majorities across nearly all groups in the public, including 68% of Democrats and 61% of Republicans.” Continue reading
Changing the Minimum Wage
Center on Budget and Policy Priorities posted a story on movement in the Senate to change the minimum wage. When the minimum wage is standardized to 2013 dollars, it is clear that the minimum wage has not kept pace with inflation. The dollar is worth less.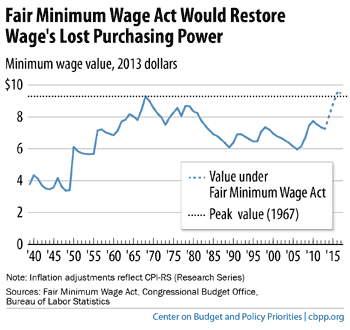
They write:
“The Senate is soon expected to consider a proposal to raise the minimum wage from $7.25 to $10.10 in three annual increments and then index it to inflation. The proposal — the Fair Minimum Wage Act of 2013 (FMWA), introduced by Senator Tom Harkin (D-IA) — also would raise the subminimum wage paid to those who also receive tips, which has been frozen at $2.13 for over two decades. The FMWA would provide low-wage workers with a much-needed boost to their paychecks: today’s minimum wage is 22 percent below its late 1960s peak, after adjusting for inflation. It also would help offset some of the unfavorable trends facing low-wage workers, including stagnant or falling real wages, too little upward mobility, and a deep deficit of bargaining power that leaves them solidly on the “have-not” side of the inequality divide.”
Read the article: Click Here
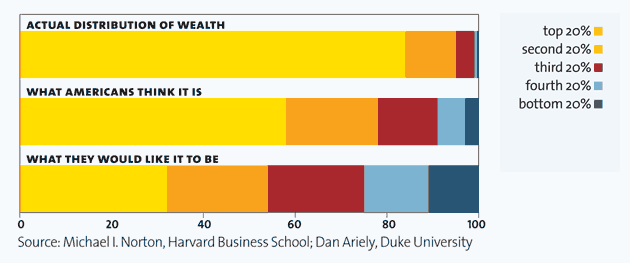
More on Wealth Inequality in America
An interesting video on wealth inequality–a way to show what wealth inequality in the US looks like.
Upworthy: Income Inequality Explained
Of course, you would still want to verify the accuracy of the data, but as way to portray a complex issue using data–well, I am impressed.
Note: they offer a link to Mother Jones as a source of the data: Click Here
Income Inequality continued
The Center on Budget Policy and Priorities has provided more information about the latest Census report on Poverty and Health Insurance. Once chart compares the income shares by quintiles of 1967 and 2012.
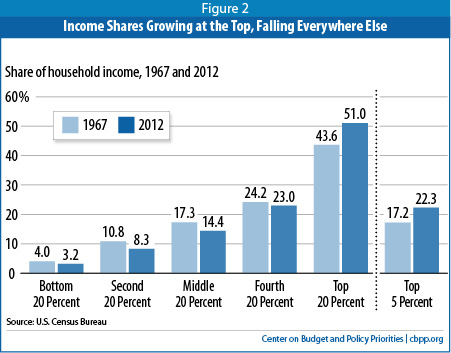
To read article: Click Here
The article notes that there may be some challenges in accurately capturing the income of those at the very top, and therefore accurately measuring changes. They write:
“Other data suggest the Census figures may underestimate the rise in inequality. Census trends on income inequality must be regarded cautiously because of large gaps in the Census income data, especially the omission of substantial income going to people high on the income scale. For example, Census does not collect data either on capital gains income or on salaries above $1,099,999; an individual whose salary rises from $20 million to $25 million between 2011 and 2012 is recorded as earning $1.1 million in both years.”