 As people march against access to military-style assault weapons and begin to organize a voting campaign, it helps to see the data. While mass shootings, such as the one in the Parkland, Florida school, are a small slice of all gun deaths, it appears to be a tipping point for public policy. “Never again,” as the students say. There seems to be something wrong with having a generation of children growing up in fear that they or their friends might be killed while at school, a mall, a concert or in a movie theater.
The data varies depending on how mass shooting is defined; the definition changed from at least 4 people killed to 3 people killed in 2013. It includes school shootings, as well as work shootings and other public settings (malls, nightclub, movie theater, churches, etc), but not killings associated with other crimes, domestic violence, or gang violence. It may or may not include a killing spree. The dates included also can vary. One report begins counting from 1966 and another from 1982; the earlier start date reports more shootings and fatalities.
None of the data sources listed below provide information about the total number of school shootings. Nor does the data account for the full impact on those wounded and those who survived with trauma, nor does the data account for the impact on friends, families, and neighbors.
The Washington Post published data after the Parkland Florida school shooting in February 2018. https://www.washingtonpost.com/graphics/2018/national/mass-shootings-in-america/?utm_term=.22bde03099b3
“In the 50 years before the Texas tower shooting (August 1, 1966), there were just 25 public mass shootings in which four or more people were killed, according to author and criminologist Grant Duwe.”
They summarize the data since 1966:
- 1,077 people have been killed in mass shootings
- 153 shooters, almost all men
- most between the ages of 20-49
- 292 guns were used, most were obtained legally.
- The use of semi-automatic, military style weapons increased dramatically once the ban on those weapons expired in 2004.
 Time Magazine published 35-years of mass shooting data at the end of 2017 and present it as a single chart—a big chart. It includes the number killed as well as the number wounded in each shooting. Click Here: http://time.com/4965022/deadliest-mass-shooting-us-history/
The data was compiled by Mother Jones. The Time Magazine includes this note:
“As Mother Jones‘ Mark Follman notes, the actual number of fatalities is probably higher. A 2013 federal mandate authorized by President Obama lowered the definition of a mass shooting down from four victims to three, which led to more of these shootings being tracked, but there may be earlier ones that are not included. The chart also does not include the thousands of killings each year in which there were fewer than three fatalities.”
The Mother Jones data set can be found here:
https://www.motherjones.com/politics/2012/12/mass-shootings-mother-jones-full-data/
They note:
“In July 2012, in the aftermath of the movie theater massacre in Aurora, Colorado, Mother Jones created the first open-source database documenting mass shootings in the United States. Our research has focused on indiscriminate rampages in public places resulting in four or more victims killed by the attacker. We exclude shootings stemming from more conventional crimes such as armed robbery or gang violence. Other news outlets and researchers have published larger tallies that include a wide range of gun crimes in which four or more people have been either wounded or killed. While those larger datasets of multiple-victim shootings may be useful for studying the broader problem of gun violence, our investigation provides an in-depth look at the distinct phenomenon of mass shootings—from the firearms used to mental health factors and the growing copycat problem. Tracking mass shootings is complex; we believe ours is the most useful approach.”
Their summary of data from 1982-2018
- At least 97 public mass shootings across the country, with the killings unfolding in 34 states.
- Fifty-eight of these mass shootings have occurred since 2006.
- Of the 143 guns possessed by the killers, more than three quarters were obtained legally.
- The arsenal included dozens of assault weapons and semi-automatic handguns with high-capacity magazines
- More than half of the cases involved school or workplace shootings (12 and 20, respectively); the other 30 cases took place in locations including shopping malls, restaurants, and religious and government buildings.
- Forty-four of the killers were white males. Only one was a woman.
The data from Mother Jones, which can be downloaded into a spread sheet, can be used for more analysis. A time-line of number of incidents can be constructed, as well as a chart of the number killed and wounded per incident over time. The type of gun used over time, and correlate with the total number killed and wounded.
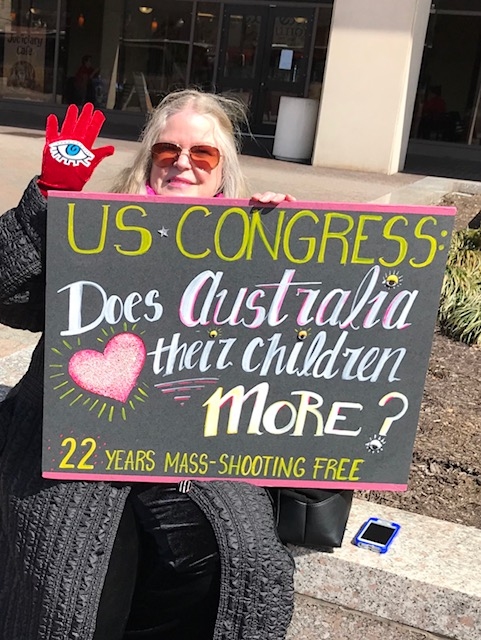 A ban on military-style weapons and other restrictions on gun ownership (like age restrictions, drug testing, or requiring training and licensing as we do to drive cars) may not be a guaranteed 100% protection–although the assault weapon ban in Australia seems to have been very effective. However, it seems reasonable to assume that making it harder to obtain an assault weapon will stop some mass shootings. And in the world of public policy, better is often as good as it gets.
Additional sources: Violence Policy Center, Gun Violence Archive; FBI 2014 Study of Active Shooter Incidents; published reports.
Comparison of gun ownership among developed nations might also provide insight into the gun violence in the U.S. See data at Australian research site gunpolicy.org.