Congress: Does it Look like America?

PEW just posted a quick look at the 115th Congress that began in 2017.  See Report: Click Here   They looked at 5 demographic factors.

  • How ethnically diverse? PEW reports: “The current Congress is the most racially and ethnically diverse ever. Nonwhites – including blacks, Hispanics, Asians/Pacific Islanders and Native Americans – now account for 19% of Congress.”   How does it compare to the past? In 1945, just 1% were non-whites. So better than the past. Yes.  But how does it compare to the nation as a whole? 38% of the nation is nonwhite. So, there is still progress to be made here.  Note: the chart they use is not helpful.  It shows the breakdown by ethnicity but does not include whites, so the reader has not sense of the percentages of the whole.
  • How are women doing? It is slow. “Women now hold 104 seats, or about one-in-five overall (19%), tying the record set by the 114th Congress.” Their chart shows the percent of women in the senate and the house separately, over time, but do not show the overall percent over time. .  However, they do acknowledge that women comprise 51% of the population, so they are still under-represented.  Center for American Women and Politics puts it in a bigger picture: 
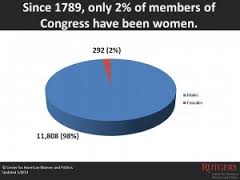
For More info From CAWP Click Here


Continue reading »

Election Audit: What Can Be Concluded?

recountHeadline in the Guardian: “US recounts find no evidence of hacking in Trump win but reveal vulnerabilities” Click Here

The article points to conclusions given by J Alex Halderman and Matt Bernhard, both of the University of Michigan.  “After the talk, Bernhard clarified that no evidence of hacking is not the same as evidence of no hacking. “We didn’t conclude that hacking didn’t happen,” he told the Guardian, but “based on the little evidence we have, it is less likely that hacking influenced the outcome of the election.”

Got that? Continue reading »

Electoral College: How Equal Is It?

Once again, we have an election where the candidate with the most vovotetes did not win the Presidency. As things stand now on December 1, 2016, according to CNN, Trump has 306 Electoral Votes and Clinton has 232. Put another way, Trump is projected to have 57% of the Electoral College votes. But in the popular vote, Clinton has almost 65 million votes compared to Trump’s almost 63 million votes. By CNN’s calculations, Clinton won 48 percent of the popular vote to Trump’s 46 percent. See CNN Click Here

This mismatch has provoked questions about the Electoral College.

The Constitution says Electors from each state will be equivalent to its Congressional delegation: the number of Senators and Representatives. Every state has two Senators, regardless of population size. The House of Representatives is proportional, with number of Representatives reflecting the population of each state.

The Constitution further stipulated: “The Number of Representatives shall not exceed one for every thirty Thousand, but each State shall have at Least one Representative.” That requirement was deleted when Congress capped the number of Representatives at 433 in the Apportionment Act of 1911 and finalized in 1929 at 435. Given our current population of over 300 million, the House of Representatives would have over 10,000 members to maintain that 1/30,000 ratio.  The current ratio is around 1 representative for every 720,000 people.

The problem for the Electoral College is that it includes the two senators from each state: Alaska, with 735,000 people gets 2 Senators, and California, with 38 million gets 2 Senators. At the time of the Constitution was being written, compromises were made. The Senate was one of those compromises; small states did not want to be swallowed up by the large states so each state was guaranteed equal representation. The People’s House was reflected the states’ population.

However, when translated into Electoral College votes, there is a bias towards the small states. Alaska has a small population and gets 3 Electors. CNN reported that 246,591 ballots were counted in the Presidential race in Alaska. This means that there are 82,197 voters for every 1 Electoral College voter. California, being a large state, gets 55 electors. Almost 12 million ballots were counted in California, resulting in 217,351 voters for every 1 Elector. An Alaska voter has a louder voice than a voter in California. Continue reading »

The Reemergence of Liberals Among Youth?

The New York Times ran a story about the views of young people: Young, Liberal and Open to Big Government. They wrote:

“It is no secret that young voters tilt left on social issues like immigration and gay rights. But these students, and dozens of other young people interviewed here last week, give voice to a trend that is surprising pollsters and jangling the nerves of Republicans. On a central philosophical question of the day — the size and scope of the federal government — a clear majority of young people embraces President Obama’s notion that it can be a constructive force, a point he intends to make in his State of the Union address on Tuesday.
‘Young people absolutely believe that there’s a role for government,” said Matt Singer, a founder of Forward Montana, a left-leaning though officially nonpartisan group that seeks to engage young people in politics. “At the same time, this is not a generation of socialists. They are highly entrepreneurial, and know that some of what it takes to create an environment where they can do their own exciting, creative things is having basic systems that work.’”

Read article:Click Here


PEW: Low Trust in Government, Majority Feels Government is Threat to Liberty

January 31, 2013: “The latest national survey by the Pew Research Center for the People & the Press, conducted Jan. 9-13 among 1,502 adults, finds that 53% think that the federal government threatens their own personal rights and freedoms while 43% disagree.”

The low trust in government continues, while 26% is a slight increase, it is nothing to rave about. Favorability of Congress continues to decline as well. The shenanigans with the federal budget and so called fiscal cliff probably were contributing factors..


Continue reading »

Understanding Political Polls

From NPR-Diane Rehm show: Understanding Political Polls Polls have become the news. As in past elections, polling data, fund raising, and ad critiques have, I am sure, eclipsed any substantive debate/discussion about the many serious issues that faces our nation. We just like the horse-race. That said, conducting polls is much harder today because it is challenging to get a representative sample. Polls that exclude cellphones also exclude very particular groups of people who might have be more likely to vote for one candidate rather than another. As a result, the polls will be a poor representation. It is also true that national samples will be a poor predictor of results of the electoral college. This is worth listening to. And no doubt, there will be lots of analysis about which polling company did the best in predicting the 2012 presidential results. It will be curious if 7/11 predicts this one (see earlier post), but then, they have a 50-50 chance of being right!

PEW Study: Partisan Polarization Surges in Bush, Obama Years

June 4, 2012
“As Americans head to the polls this November, their values and basic beliefs are more polarized along partisan lines than at any point in the past 25 years. Unlike in 1987, when this series of surveys began, the values gap between Republicans and Democrats is now greater than gender, age, race or class divides.

Overall, there has been much more stability than change across the 48 political values measures that the Pew Research Center has tracked since 1987. But the average partisan gap has nearly doubled over this 25-year period — from 10% in 1987 to 18% in the new study.”

Read the full report which includes detailed findings on these subjects:

See also a slideshow summarizing the survey’s key findings and an interactive database containing the full history of the values studies.