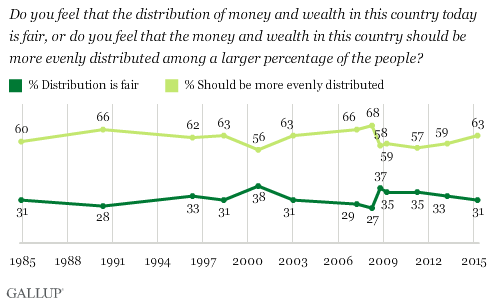
According to a recent Gallup Poll: “Despite the growing focus on inequality in recent years, the 63% of Americans who say that money and wealth should be more evenly distributed among a larger percentage of the people is almost the same as the 60% who said this in 1984.”
Author Archives: mollie
Happiness: A Function of Ideology?
The New York Times reported a story today that looked at research about happiness and ideology. The research suggests what while conservatives are more likely to report being happy, liberals are more likely to evidence happy behaviors.
See NY Times article: Click Here
The article described several studies. You can get a sense of the challenges by looking at the different measures and methodologies. For example, “One study analyzed the emotional content of more than 430 million words entered in the Congressional Record over 18 years. Liberal-leaning politicians, the researchers found, were more likely to use positive words and no more likely to use sad or negative words.” Continue reading
Child Poverty Rates Decline When Government Programs are Measured
The Annie Casey Foundation in a report “Measuring Access to Opportunity in the United States” released a report using the latest data about child poverty in the U.S. In this report, they estimated the impacts of several key federal government anti-poverty programs. They conclude that the percent of children living in poverty declined from 33% to 18% when government programs are included. They state:
“The federal government’s official poverty measure, created in the 1960s, fails to illustrate the impact of programs designed to help families succeed. This KIDS COUNT data snapshot highlights the Supplemental Poverty Measure (SPM), which captures the effect of safety-net programs and tax policies on families. By using the SPM, researchers have determined that the child poverty rate has declined from 33% to 18% as a result of these programs and policies.”
See Report: Click Here
Income Gap Continues to Widen
PEW released a new report showing that both the income and wealth gap continued to widen between the upper class and the middle and low classes.
Click Here for Report
Of course, it helps to know how they define middle class. I am not sure that a single person earning $22,000 would see that as a middle class wage. In many parts of the country, it would not even be a living wage.
They also look at wealth differences:
Spurious Correlations
Stumbled on this–it is a great reminder that many things may appear to be related but really not so much: Click Here
Body Mass Index: How Good a Measure
Mother Jones posted an article questioning whether the body mass index is “a big fat scam.” It raises questions about the measure itself, the extent to which it is a predictor of health, and the politics.
See article: Click Here
In brief, the authors write:
“Doctors typically use BMI to advise their patients: If you’re below 18.5, you’re underweight; 18.5-24.9 is normal; 25-29.9 is overweight; and 30-plus is obese.
There’s just one problem: A higher BMI doesn’t necessarily mean you’re less healthy. In fact, patients with heart disease and metabolic disorders whose BMIs classify them as overweight or mildly obese survive longer than their normal and underweight peers. A 2013 meta-analysis by the National Center for Health Statistics looked at 97 studies covering nearly 3 million people and concluded that those with overweight BMIs were 6 percent less likely to die in a given year than those in the normal range. These results were even more pronounced for middle-aged and elderly people. This is known as the obesity paradox. “The World Health Organization calls BMIs of 25 to 29.9 overweight,” says Paul McAuley, an exercise researcher at Winston-Salem State University. “That is actually what is healthiest for middle-aged Americans.”
“And get this: While epidemiologists use BMI to calculate national obesity rates (nearly 35 percent for adults and 18 percent for kids), the distinctions can be arbitrary. In 1998, the National Institutes of Health lowered the overweight threshold from 27.8 to 25—branding roughly 29 million Americans as fat overnight—to match international guidelines. But critics noted that those guidelines were drafted in part by the International Obesity Task Force, whose two principal funders were companies making weight loss drugs. In his recent book Fat Politics: The Real Story Behind America’s Obesity Epidemic, political scientist Eric Oliver reports that the chairman of the NIH committee that made the decision, Columbia University professor of medicine Xavier Pi-Sunyer, was consulting for several diet drug manufacturers and Weight Watchers International.”
The measure itself is problematical. People with muscle will likely have higher BMI, but the BMI does not account for that differential.
Sometimes simple measures are not as accurate as we would like, making prediction about causality problematical. This is a great topic for those looking to explore the nexus of science, the media, public policy, and politics.
links: Washington Post article: change to BMI standard: Click here
Link to obesity meta analysis study:Click here
Stressed Out?
Science stat’s published research about Americans and stress, looking at several demographic and situational factors that might contribute to stress. Click here for article
They described the methodology:
“About the study:
Interviews were conducted via telephone (including both landline and cell phone) between March 3 and April 8, 2014, among a nationally representative sample of 2,505 adults age 18 and older. The interviews were conducted in English and Spanish. To compensate for known biases and variations in probability of selection within and across households, sample data were weighed by household size, cell phone/landline use and demographics to reflect the true population. Random-digit dialing, replicate subsamples, and systematic respondent selection within households, were used to ensure that the sample is representative.”
What surprises you? What does not? What factors might explain variations in reported stress levels by gender or income? What other factors might affect stress levels that they did not ask about?
The Inevitability of Income Inequality?
Joseph Stiglitz posts his opinion in today’s NY Times, arguing that the income inequality in the US is not inevitable. It is the result of political decisions. He concludes: “Widening and deepening inequality is not driven by immutable economic laws, but by laws we have written ourselves.”
Read the article: Click Here
Critical Thinking about Political Polling
In the NY times today: When Polling is More Like Guessing, by Nate Cohen.
Click Here
He leads with this opinion:
“Election analysts and forecastersdepend on accurate polling. Unfortunately, there’s not much of it so far this cycle.
Many of the surveys to date have been conducted by firms that use automated phone surveys and combine deficient sampling with baffling weighting practices.”
He goes on to provide evidence of some of the disconnects between polling results in terms of projected demographics versus likely demographics about who will vote. Differences in demographics will alter predictions.
To the extent that polling predictions affect actual votes–which is an interesting research question–it is perhaps more than just an argument about demographics.
The Politics of Income Inequality: The story continues
article in NY Times: Click Here