Category Archives: Poverty
Child Poverty Rates Decline When Government Programs are Measured
The Annie Casey Foundation in a report “Measuring Access to Opportunity in the United States” released a report using the latest data about child poverty in the U.S. In this report, they estimated the impacts of several key federal government anti-poverty programs. They conclude that the percent of children living in poverty declined from 33% to 18% when government programs are included. They state:
“The federal government’s official poverty measure, created in the 1960s, fails to illustrate the impact of programs designed to help families succeed. This KIDS COUNT data snapshot highlights the Supplemental Poverty Measure (SPM), which captures the effect of safety-net programs and tax policies on families. By using the SPM, researchers have determined that the child poverty rate has declined from 33% to 18% as a result of these programs and policies.”

See Report: Click Here
Have the Anti-Poverty Programs Failed?
The growing consensus is that the war on poverty has not failed once you use more appropriate measures, according to John Cassidy in the New Yorker. To see the article: Click Here.
He shows a chart using the official poverty measure. The official poverty measure was created in 1963 based on a multiple of a thrifty meal plan. It has long been regarded as an inaccurate measure in terms of actually measuring what people need to meet basic costs of living (technical term: it lacks content validity). However, it has the benefit of being reliable because it is the same measure merely adjusted for inflation, so it is an apples-to-apples comparison.
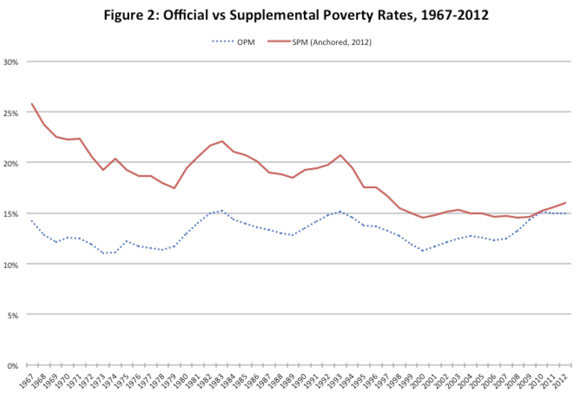
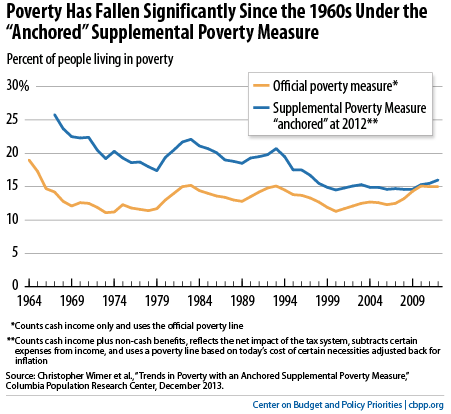
Other measures have been proposed, and he shows how the data looks using a revised measure created by the Census Bureau and used by researchers to do a more accurate analysis. Cassidy writes about the solid red line: “It represents the Columbia researchers’ estimate of historical poverty rates according to a new and more comprehensive measure of need that the Census Bureau created in 2011, known as the supplemental poverty measure (S.P.M.). According to this revised metric, the poverty rate in 1967 was as high as twenty-six per cent. It has since fallen dramatically, to sixteen per cent in 2012; in the period immediately before the Great Recession, it fell below fifteen per cent.” Continue reading
Assessing the War on Poverty
 Nicholas Kristof wrote an OpEd piece in the NY Times (january 8, 2104) looking at the efforts by the federal government to end poverty. Find is article:Click Here
He notes:
“A Columbia University study suggests that without government benefits, the poverty rate would have soared to 31 percent in 2012. Indeed, an average of 27 million people were lifted annually out of poverty by social programs between 1968 and 2012, according to the White House Council of Economic Advisers.
The best example of how government antipoverty programs can succeed involves the elderly. In 1960, about 35 percent of older Americans were poor. In 2012, 9 percent were. That’s because senior citizens vote, so politicians listened to them and buttressed programs like Social Security and Medicare.
In contrast, children are voiceless, so they are the age group most likely to be poor today. That’s a practical and moral failure.”
He points to a new book: “Legacies of the War on Poverty,”
He concludes:
“Critics are right that antipoverty work is difficult and that dependency can be a problem. But the premise of so much of today’s opposition to food stamps and other benefits — that government assistance inevitably fails — is just wrong. And child poverty is as unconscionable in a rich nation today as it was half a century ago.”
The War on Poverty: 50 Year View
The Center on Budget and Policy Priorities has prepared a report that looks at the war on poverty advocated by President Lyndon Johnson and passed by the U.S. Congress 50 years ago. Other programs have been added over time, but it has been tough going. Over 20 percent of all children in America live in poverty.
The debate continues–not only about whether the war on poverty has worked but how to measure poverty. The CBPP provides an overview of the issues along with its perspective that the programs have worked to reduce poverty but there is still way too much poverty and that it has impacted some groups more than others. To read more Click Here
The New York Times has also published an interactive map of poverty in America. Clearly, some areas have much higher rates of poverty–well over 30 percent. To check it out:Click Here
Of course, some of the programs provide supports and services to lessen the impact of poverty, such as Head Start and Medicaid. Neither of those programs reduce poverty, although certainly there is great hope that Head Start will provide children with early skills that will enable them to be successful in school and go on to college. Medicaid provides health care so poor children have access to services that their families can not afford. Measuring the impact is certainly challenging, but only the most hardened Scrooges among us would be unwilling to grant that without these programs, far more people would live in poverty and would suffer far more deleterious effects if no safety net was in place.
Poverty in America
The Census came out with the latest figures on poverty in America:
The data presented here are from the Current Population Survey (CPS), 2013 Annual Social and Economic Supplement (ASEC), the source of official poverty estimates. The CPS ASEC is a sample survey of approximately 100,000 household nationwide. These data reflect conditions in calendar year 2012.
- In 2012, the official poverty rate was 15.0 percent. There were 46.5 million people in poverty.
- For the second consecutive year, neither the official poverty rate nor the number of people in poverty at the national level were statistically different from the previous year’s estimates.
- The 2012 poverty rate was 2.5 percentage points higher than in 2007, the year before the most recent recession.
- In 2012, the poverty rate for people living in the West was statistically lower than the 2011 estimate.
- For most groups, the number of people in poverty did not show a statistically significant change. However, between 2011 and 2012, the number of people in poverty did increase for people aged 65 and older, people living in the South, and people living outside metropolitan statistical areas.
- The poverty rate in 2012 for children under age 18 was 21.8 percent. The poverty rate for people aged 18 to 64 was 13.7 percent, while the rate for people aged 65 and older was 9.1 percent. None of these poverty rates were statistically different from their 2011 estimates. Click Here
The Census provides a PDF file that looks at poverty over time: Click Here
Poverty in America: facts from Moyers and Company
U.S. Poverty: By the Numbers
May 29, 2013
U.S. poverty (less than $17,916 for a family of three): 46.2 million people, 15.1 percent

Click pie chart to enlarge. Read the full report at the National Center for Children in Poverty website.
Children in poverty: 16.1 million, 22 percent of all children, including 39 percent of African-American children and 34 percent of Latino children. Poorest age group in country.
Deep poverty (less than $11,510 for a family of four): 20.4 million people, 1 in 15 Americans, including more than 15 million women and children
People who would have been in poverty if not for Social Security, 2011: 67.6 million
(program kept 21.4 million people out of poverty)
People in the U.S. experiencing poverty by age 65: Roughly half
Gender gap, 2011: Women 34 percent more likely to be poor than men
Gender gap, 2010: Women 29 percent more likely to be poor than men
Twice the poverty level (less than $46,042 for a family of four): 106 million people, more than 1 in 3 Americans
Jobs in the U.S. paying less than $34,000 a year: 50 percent
Jobs in the U.S. paying below the poverty line for a family of four, less than $23,000 annually: 25 percent
Poverty-level wages, 2011: 28 percent of workers Continue reading
State of America’s Children–July 2012
 For those seeking data about children in America, the Children’s Defense Fund recently released its annual report. The report, which can be downloaded, is at:
State of America’s Children
It includes this critique of the Gross National Product by Robert F. Kennedy that I like. He raises questions about what we measure and the validity of those measures, and is far more eloquent than I am, who as a researcher would talk about operationalization of terms and content validity.
“Yet the gross national product does not allow for the health of our children, the quality of their education, or the joy
of their play. It does not include the beauty of our poetry or the strength of our marriages; the intelligence of
our public debate or the integrity of our public officials. It measures neither our wit nor our courage; neither
our wisdom nor our learning; neither our compassion nor our devotion to our country; it measures everything,
in short, except that which makes life worthwhile. And it tells us everything about America except why we are
proud that we are Americans.”
– Robert F. Kennedy
Poverty in America
Testimony by Ron Haskins of the Brookings Institute before the Congressional Finance Committee focused on poverty. He looked at causes as well as federal policies. See his testimony at: Ron Haskins Testimony
He begins by noting that little progress has been made in eliminating poverty and points to Figure 1:

Unsurprisingly, the number of people living at or below the poverty line has increased as the economy retracted. Continue reading
Food Stamps: CBO Reports
Some great information about federal food stamps program published by the Congressional Budget Office:
Supplemental Nutrition Assistance Program
SNAP spending and participation reached record levels in 2011. Nearly 45 million recipients, one out of every seven U.S. residents, received SNAP benefits in an average month in fiscal year 2011. Total federal spending for the program was $78 billion.
To put it in context of daily life:
Average Adjusted Benefit Per Person Per Day (inflation adjusted dollars):
$2.49 in 1980
$2.71 in 1990
$2.67 in 2000
$3.97 in 2010
They also published another report that looked at policy options:
Policy Options