Tax Expenditures

A tax expenditure program is government spending through the tax code. Tax expenditures allow exemptions, deductions, or credits to select groups or specific activities. Some might call them tax loopholes or tax write-offs.

Or, as the Treasury states:  :Tax expenditures are revenue losses due to preferential provisions of the Federal tax laws, such as special exclusions, exemptions, deductions, credits, deferrals, or tax rates.”

One of the problems with funding things by tax code write-offs is that these are similar to entitlements (see prior 
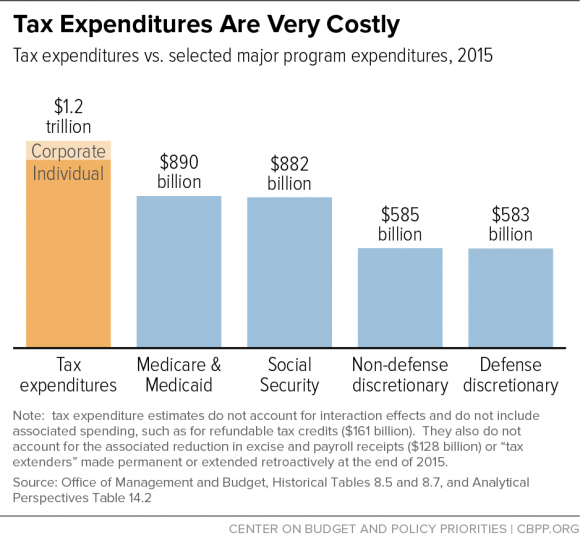
post), meaning that everyone who is eligible receives the tax write-offs .  As such, they are no limits to the total amount of taxes that are written off. The other problem is that there is no debate or discussion about whether these write-offs are appropriate expenses of government or whether they are effective in accomplishing any policy objectives or goals. Another problem is that we don’t see these tax write-offs in context with other government spending. For example, are tax write-offs for business meals more worthwhile for our society than money spent to feed poor children?

Tax expenditures are essentially hidden government expenditures that do not show up in the budget documents. The lack of transparency creates the sense that the top political donors receive benefits that are denied to lower-income families.

For more information, see report by Tax Policy Center:Click Here

Continue reading »

Taxing the Rich?

This from Paul Krugman’s blog: Taxing the Rich post

He writes: “First, over the past three decades we’ve seen a soaring share of income going to the very top of the income distribution (right scale) even as tax rates on high incomes have fallen sharply, with the recent Obama increases clawing back only a fraction of the previous cuts.”


The essential question is simply this:  what income distribution is best for America as a whole? Does inequality hurt the economy, and if so, how much income inequality can be tolerated before it harms the economy? Given that we have a consumer-based economy, if people are limited in the amount of consumption because they have limited resources, at what point does the economy stall? At what point does it make an economic recovery fail?

The same question can be posed about taxes. What is the best tax structure for America as a whole? There is no question in my mind that the Bush-era tax cuts were a huge failure from the perspective of both the federal deficit and the debt. We quickly went from a budget surplus to a budget deficit, that got worse as the economy continued to weaken. Other factors played a role, but when the budget started to cross into the red, and especially with the costs associated with two wars, the tax cuts should have been canceled. Continue reading »

What Do We Know About the 47% Who Did Not Pay Income Tax?

Politics and taxes. So the latest flap in the news is presidential candidate Romney’s statement about how the 47% who don’t pay taxes see themselves as “victims,” are dependent on government and do not understand personal responsibility.

True? What does the data say? From all accounts, 47% did not pay federal income taxes is accurate.

Is that too much or is it unfair? That is a judgmental call.

Are these 47% living off the government? Well, there is some data that can help us determine the truthfulness of that statement.

In a recent post, I tried to figure out how much income defined the middle-class household. With 25 percent of the households earning less than $25,000, they are very likely to have little or no federal tax liability and might, in fact, be eligible for earned income tax credits. That policy was designed to help people who work at low-wage jobs.

It is also true that with the median income around $50,000–well, with deductions for mortgage interest, equity loan interest, property tax deductions, child care, and medical deductions, it is not surprising that some households have more deductions than tax liabilities. They would therefore get a refund of all taxes withheld.

But that is just my general assumption. So I poked around to see if others had gone deeper. Continue reading »

Federal Income Tax Receipt–2012

The National Priorities Project has provided a report on our federal tax dollars at work.

“While you may not get a receipt from the IRS any time soon, National Priorities Project went ahead and wrote one up. This receipt shows where $2,654 in income taxes was spent by the government in fiscal 2011. That’s an estimate of the taxes paid by a single person earning around $30,000 annually.”

It should be noted that they do not include payroll taxes that are designated for Social Security and Medicare Trust Funds.

Still, it is an interesting way to present budget data.

Source: National Priorities Project: Your Tax Receipt

Tax Breaks Add Up To $1.1 Trillion, As Much As Federal Budget Deficit

A former student posted this Huffington Post article on my facebook page. HuffingtonPost article Needless to say that got my attention. The author, Alexander Eichler, leads off the article:

“Take all the tax breaks in the U.S. tax code and put them together.
You’ll find that they add up — and up and up.
That’s the conclusion of a recent report from the Congressional Research Service, an arm of the Library of Congress that provides research and analysis for federal lawmakers. In a report issued last week, the CRS found that all the major tax breaks currently in use in America add up to about $1.1 trillion a year.”

Coincidentally, that is about the size of the FY 2014 projected budget deficit.

Of course, to get into the tax code is very complicated and requires more than a bit of geekiness, which I mean in a good way. So, I have downloaded the CRS report. Continue reading »

Lies, Damn Lies and Statistics

I received an email from Vice President Biden telling me that the tax deal struck by Obama and the Republicans in Congress is a good deal. If the Bush-era tax cuts are allowed to sunset, it would cost the average taxpayer $3,000.
Really? The tax deal may or may not be good, but I am very wary about averages. When you are in a situation where there is a huge income disparity, the average gives a distorted picture of reality. If the administration is going to be honest about the numbers, they should provide the median rather than the mean (average). And if they are going to use the mean, they should also show the standard deviation.
Now these guys know that. So the fact that they resorted to a statistical distortion to convince people to support their budget deal made me seek better information.

The Washington Post provides an interactive site so you can seen the impacts of the various options. See story at:
Washington Post Tax Plan Comparison
Continue reading »