Was Slavery the Reason for the Civil War?

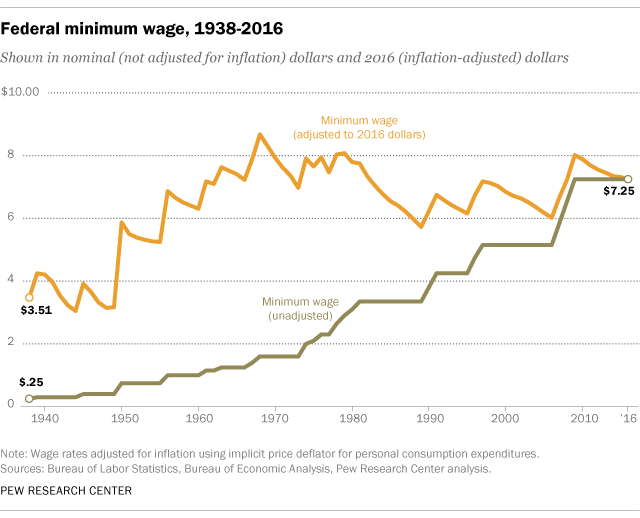
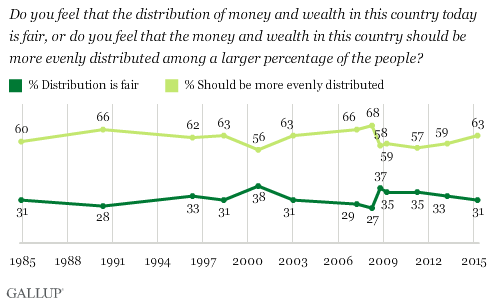
I like to paint a picture by numbers because it seems more objective to me at capturing the truth of what is real. Yes, I know that people can lie using numbers as much as they can by words. Still my preference is for numbers and evidence.

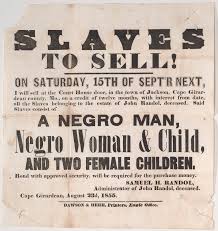
That said, there are times when numbers do not work so other methods for ascertaining the true story are needed. For example, what was the civil war about? Some believe it was clearly a fight over slavery and white supremacy. Others say it was about state’s rights. Still others say it was all about economics.

In this situation, it helps to go back to the documents—speeches and the Constitution drawn up by the Confederate States of America (CSA)–and see what clues they provide. Historical research of documents.

Background: In February of 1861 six states seceded from the United States of America and formed a new nation—the Confederate States of America (CSA). In the months that followed, seven more American states followed suit.  The Confederate Constitution was approved on March 11, 1861. It was almost exactly like the U.S. Constitution. Continue reading »

2016 Presidential Election: Just the Numbers

voteIt should not come as a great surprise that I like numbers. Nor should it come as a surprise that I get grumpy when numbers get ignored or distorted to create a false narrative. So, I am wading into this quagmire knowing that the final results have not yet been posted on the Federal Election Commission’s website.

According to the Election Project, there were an estimated 231,556,622 eligible voters and 138,337,814 ballots counted in the 2016 Presidential election.  Voter turnout was just under 60%, Voter turnout is closer to 55% if the total adult population of 251,107,404 is used.

The results (which will likely change slightly once the FEC posts the final numbers) are:

Trump received 62,955,363 votes, or 45.5% of the presidential votes. He won 306 Electoral College votes.

Clinton received 65,788,583 votes or 47.5% of the presidential votes. She won 232 Electoral College votes.

Others, including write-ins, received 9,593,686 or about 7% of the ballots. Continue reading »

Cost of Not Going to College

thinking-of-skipping-collegeI posted PEW research awhile back about the differences among Millennials who do and do not go to college. Click Here for PEW article
John Hawthorne shared a recent article he co-authored, “Thinking of Skipping College”.  It presents similar information in an accessible way. Click Here It is fun to see how statistical information can be presented.

They conclude: “It turns out that, despite the insistence of some, college is still incredibly valuable. The statistics prove that opting out of a university degree will dramatically hurt people in the long run, damaging their earning potential, increasing the likelihood of unemployment, and decreasing job satisfaction.

George Washington Carver said, “Education is the key to unlock the golden door of freedom.” He may not have had access to the statistics, but it turns out he was right.”

– See more at: https://www.cornerstone.edu/blogs/lifelong-learning-matters/post/thinking-of-skipping-college-here-are-6-stats-to-change-your-mind#sthash.sedV5o5Y.dpuf

Minimum Wage

PEW:  Minimum Wage

pew_minwage_1938_2016


Five Facts:

  1. Adjusted for inflation, the federal minimum wage peaked in 1968 at $8.68 (in 2016 dollars). Since it was last raised in 2009, to the current $7.25 per hour, the federal minimum has lost about 9.6% of its purchasing power to inflation.
  2. Less than half (45%) of the 2.6 million hourly workers who were at or below the federal minimum in 2015 were ages 16 to 24. An additional 23.3% are ages 25 to 34, according to the Bureau of Labor Statistics; both shares have stayed more or less constant over the past decade. That 2.6 million represents less than 2% of all wage and salary workers. (See more about the demographics of minimum-wage workers
  3. Twenty-nine states, plus the District of Columbia and nearly two dozen cities and counties, have set their own higher minimums.
  4. About 20.6 million people (or 30% of all hourly, non-self-employed workers 18 and older) are “near-minimum-wage” workers.
  5. The restaurant/food service industry is the single biggest employer of near-minimum-wage workers.

See data:Click Here

Health: Racial Disparities

The Harvard School of Public Health held an expert panel to discuss racial disparities.
They note: “Each speaker acknowledged that racial minorities have made significant gains over the past half-century, but said there is much more work still to do. They cited statistics providing stark evidence of continuing disparities in health, wealth, education, income, arrest and incarceration rates, foreclosure rates, and poverty. Coleman called the data “disconcerting; in some cases, alarming.”
Click here to see their report

“Health care disparities are troubling, Coleman said. One study found that doctors recommended coronary revascularization—bypass surgery that replaces blocked blood vessels with new ones—among white patients with heart disease 50% of the time, but just 23% of the time for blacks. Black women are less likely to be given a bone marrow density test than white women, even when it’s known they’ve had prior fractures. And the black infant mortality rate is 2.3 times higher than that of non-Hispanic whites.”